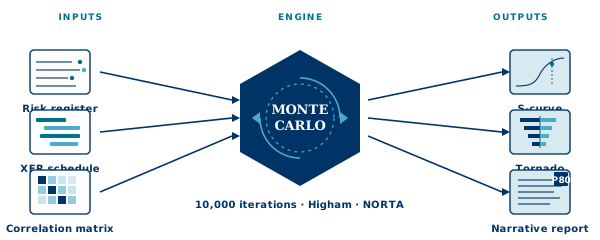
Inputs we validate before a single iteration runs.
A Monte Carlo built on a bad register is a Monte Carlo that produces bad numbers, faster. We refuse to run iterations on inputs that fail any of the structural checks below. Anything else surfaces as a warning the analyst sees, decides on, and signs off.
Correlation matrix positive semi-definiteness — a matrix that isn't PSD can't be sampled from without inventing variance. We test with the standard eigen-decomposition and route the matrix through Higham's nearest-PSD repair before sampling.
Three-point ordering — minimum ≤ most likely ≤ maximum. Reversed values fail; equal values remain valid where the configured distribution permits them.
Distribution-family validity — every risk and duration uncertainty input declares its distribution. We only accept families on the AACE-published list and check the parameters make sense for that family (e.g. BetaPERT shape parameter ≥ 1).
Probability bounds — risk probabilities live in the open interval (0%, 100%). Exact 0 and exact 100 fail validation.
Mapping coverage — every risk maps to at least one activity, unless it's explicitly flagged as non-schedule. Orphan risks are caught at validation time, not after a five-hour run.
Split impact totals — where a risk's impact is split across activities, the weights sum to 100% exactly. Off-by-one-percent rounding errors fail the check.
Once inputs validate, we generate iteration samples by drawing correlated uniform variates through the NORTA (Normal-to-Anything) transform, then mapping each marginal onto its declared distribution family.
Higham PSD repair
Real-world correlation matrices, hand-built by analysts, are almost never positive semi-definite. Higham's algorithm finds the nearest PSD matrix in Frobenius norm. We log the distance between original and repaired matrix — if it's material, the analyst sees it.
NORTA transform
Normal-to-Anything turns one correlated multivariate-normal sample into samples from any marginal family while preserving the correlation structure approximately. We use rank-based correlation throughout — see attribution below for why.
Triangular
The QSRA workhorse. Three parameters, no shape assumption, easy to defend to a non-statistician. We accept it as a default when the analyst doesn't have shape data.
BetaPERT
Three-point with shape parameter — weights the central tendency more heavily than Triangular. Common in cost risk and infrastructure schemes where expert judgement says "it's more likely to be near the middle".
Uniform
Two-point. Use sparingly — uniform usually signals "we don't know yet" rather than "all values are equally likely". Risk Studio flags Uniform-heavy registers as something to revisit.
Discrete
For risks with a finite list of outcomes — typically threats with two or three named scenarios, each with a stated probability. Probability weights must sum to 1.
Lognormal and Constant complete the six supported families. Distribution choice and parameters remain subject to the validation and review boundary.
03 · Iterations & convergence
Iteration count is recorded; convergence is reviewed.
The current controlled assurance bundle uses 10,000 iterations and seed 1. Iteration count, seed and convergence evidence are part of the run provenance; they do not turn an unaccepted result into a relied-upon one.
The candidate can surface a convergence diagnostic rather than silently extending a run. Any acceptance decision remains part of supervised evaluation and independent numerical review.
Risk Studio results · synthetic reference schemeThe Studio's own S-curve with P-value markers, run on demonstration reference data. It is not a client result or evidence of independent reliance.04 · Attribution
Spearman rank tornados — and why Spearman, not Pearson.
The tornado chart answers the question every steering group asks: which risks are driving the P80 result? We attribute using Spearman rank correlation between each input and the output finish date.
Pearson correlation measures linear association — fine when inputs and outputs are both roughly Gaussian. QSRA outputs almost never are. The duration to a key milestone is a chain of dependent activities, each with its own skewed distribution, hitting bottlenecks and constraints non-linearly. Pearson on that produces tornado ordering that mis-ranks high-impact non-linear risks.
Spearman rank correlation is monotonic — it picks up "as this input gets larger, the output gets larger" regardless of whether the relationship is linear or curved. For QSRA tornado ordering it's the correct measure, and it's what the AACE methodology guidance recommends.
05 · Per-decile attribution
What drives the P10 isn't always what drives the P80.
A single-tornado view answers "which risks drive the average outcome?". But the question that matters at sign-off is usually "which risks drive the bad outcomes?" — and the answer can be different.
Per-decile attribution re-weights each decile of the output distribution by decile_factor(d) = 0.4 + 1.2 × (d/9), then re-ranks risks. The result: fast tails (P10) surface rare-but-huge risks that almost never fire but devastate the schedule when they do; heavy tails (P80, P90) surface high-probability risks that fire in bulk and accumulate.
It's a model-based re-ranking, not an iteration-direct one — the Safran exports we benchmark against don't carry per-iteration risk attribution at sufficient resolution. We flag this explicitly in the response payload and the report. The technique is honest about what it can and can't see.
06 · Audit-replay
Every run, captured. Any past period, re-runnable to byte-identical output.
A quantitative result needs enough provenance for a later assurance reviewer to understand what was run and why. A date without its inputs, configuration and seed is not sufficient evidence.
What's captured per run — inputs (XER, register, correlation matrix, mapping), full configuration (framework choice, thresholds, distribution selections), pseudo-random seed, code version, output hashes (S-curve points, tornado ordering, P-values).
HMAC chain — each run's hash is computed over the previous run's hash plus the new payload, signed with a server key. Tampering with any past run breaks the chain from that point forward.
Byte-identical re-run — re-running a historic period from its captured bundle produces the same output to the bit, on the same machine. We test this on every release: a determinism test re-runs a benchmark scheme twice and compares output bytes.
How an assurance reviewer checks — select a recorded run, compare its provenance and rerun evidence, and investigate any mismatch rather than hiding it.
Audit log · reference viewReference view of actor, run and hash metadata designed for traceable internal assurance.07 · External-engine comparison
Comparison evidence remains under independent review.
The internal engine is compared with the approved external engine on controlled evidence. The latest authoritative product status remains AMBER / NO SHIP, with unresolved numerical differences excluded from client reliance.
No tolerance, parity or replacement claim is published as achieved. The approved external engine remains the formal system of record, and the named independent numerical reviewer must accept the bounded scope or issue a later GREEN certificate.
Detailed evidence is shared only through the governed review process; client files do not enter through this public site.
08 · Caveats
What the maths can't tell you.
A defensible QSRA is one that's honest about its limits. Here are the limits.
Model risk.
A Monte Carlo is a model. Models embed assumptions about how risks interact, how distributions behave, and how the schedule responds to delay. Risk Studio is explicit about every one of those assumptions — the SOMA QSRA Readiness checks force them onto the page — but no validator removes the underlying truth that the model is not the world.
Data quality dependency.
Garbage in is still garbage out. The validation framework catches structural errors and ordering mistakes; it cannot catch a risk register that's missing the three risks no-one wanted to write down. The most important step in a QSRA is the workshop that builds the register — Risk Studio supports it, but it can't replace it.
What Monte Carlo doesn't model.
Resource constraints (unless explicitly encoded as risks). Black-swan events outside the population the distributions were calibrated against. Step changes in scope. The day a motorway closes for an unrelated incident. The model gives you a defensible probabilistic view of known risks acting on the current schedule — that's a lot, and it isn't everything.
If you're carrying a QSRA into an assurance review, lead with these caveats. Anyone serious will respect you more for naming them than for pretending the maths is bigger than it is.
Try the maths
Run 2,000 iterations. Right here.
A two-activity synthetic schedule, sampled in your browser with a fixed seed. An illustration of the principle in miniature — the product runs the full model (correlation, NORTA, six distributions, 10,000 iterations) against approved inputs.
Activity A — Triangular(10, 14, 21) days Activity B — Triangular(5, 8, 14) days Total duration = A + B, 2,000 draws.
Seed 20260717 · mulberry32 PRNG · same seed, same histogram, every time
—
P50 · median total duration
—
P80 · the assurance favourite
—
P90 · the cautious tail
Press run — the histogram and P-values appear here. Two triangular activities only: no correlation, no risk events, no calendar. Illustrative, and not a client result.
Governed evidence
Request the current review boundary.
We can explain the methodology, current limitations and evidence route. Tagged PDF companions are machine-checked, but none is represented as independently approved until the named review closes.